BI as a Bridge: Aligning Sales, Marketing, and DataOps via Snowflake + Tableau

Sales, marketing, and DataOps rely on each other. But misaligned metrics, data silos, and lagging reports keep them out of sync.
That’s where the combination of Snowflake and Tableau create a high-performance BI stack that ends guesswork, aligns goals, and empowers everyone to act on shared, trustworthy insights.
Let’s walk through how Snowflake and Tableau bridge the gap across teams and how to implement it step-by-step.
Why Alignment Matters… In Real Terms
Here’s more accurately why alignment is important:
Sales needs real-time pipeline visibility, accurate lead quality metrics, and revenue attribution it can trust. Marketing needs to understand channel performance, track engagement touchpoints, and defend B2B marketing ROI across campaigns. DataOps is responsible for data accuracy, security, lineage, and making sure there’s one version of the truth.
Now what if all three are looking at different dashboards, working off different logic, and defining “revenue attribution” three different ways? That’s frustrating and risky.
Alignment means everyone uses the same definitions, data, and dashboards. That consistency speeds up decisions and improves outcomes.
Snowflake: The Unified Underlying Platform
Snowflake is a scalable data platform built for multi-team collaboration without compromising governance. This data warehouse is a central data operating layer where all structured and semi-structured data flows in from your CRM, marketing automation, ERP, ad platforms, and engagement tools.
Here’s what Snowflake delivers for cross-functional use:
- Secure, governed data sharing: Teams and even external vendors can access datasets without duplication.
- Real-time ingestion and transformation: New leads or campaign data don’t need a 24-hour ETL cycle to show up in reports.
- Workload isolation via virtual warehouses: Marketing and sales can query large datasets without affecting production jobs.
- Unified support for diverse data formats: Be it JSON, XML, Parquet, or CSV. All get centralized and queryable.
When all raw and transformed data is placed into Snowflake, sales, marketing, and DataOps work off the same governed layer.
Tableau: Analytics Layer Built for Cross-Team Visibility
Tableau offers a rich, user-friendly front-end where teams can explore, visualize, and collaborate, without needing SQL mastery.
Key features that make Tableau an ideal partner for Snowflake-powered BI:
- Live or extract-based connections to Snowflake: With optimized drivers and support for OAuth/key-pair authentication, Tableau stays securely and reliably connected.
- Cross-source relationships: Tableau supports relationships. This helps maintain correct levels of detail across marketing and sales data, critical for cohort or funnel analysis.
- Certified published data sources: These give stakeholders a clear green-light on which dashboards and metrics are approved, trustworthy, and production-grade.
- Collaboration and self-service: Sales managers can build their own lead funnel dashboards. Marketers can customize campaign attribution visuals. Yet all work off certified logic.
Best of all, Tableau’s Accelerators, which are prebuilt dashboard templates, offer plug-and-play starting points for CRM, marketing automation, or even ABM campaigns. The result: decreased time to insight.
Bridging Teams with Real-World BI Use-Cases
Lead-to-Revenue Transparency
Sales and marketing don’t play blame games over lead quality. Instead, Snowflake enables both to contribute data:
- Campaign impressions
- UTM tags
- Lead details
- Pipeline stages
- Closed-won amounts
Plus, Tableau visualizes it all:
- Lead velocity by channel
- Stage conversion rates
- Campaign ROI
- Revenue influenced by campaign types
Now sales and marketing have a shared view and accountability.
Customer 360 and Lifecycle Tracking
Snowflake aggregates behavioral signals across web visits, CRM activities, email interactions, and even support tickets. Tableau builds the journey:
- First-touch → MQL → SQL → Customer → Expansion
- Churn alerts based on engagement drops
- Predictive scoring models embedded via Snowflake ML integrations
Everyone sees the full customer arc. The outcome is better segmentation, targeting, and follow-ups.
Data Governance and Scale
Every team doesn’t create their own version of “lead score” or “retention rate.” Rather, DataOps defines this centrally in Snowflake using SQL transformations. These certified metrics are published to Tableau with metadata, descriptions, and access control.
So even when marketing builds a new dashboard or sales tweaks a funnel, the core logic stays intact. Compliance and scalability? Solved.
8 Practical Implementation Steps
Step 1: Audit Your Data Landscape
Inventory every data-generating tool across departments. These include CRMs like Salesforce or HubSpot, marketing tools like Marketo or Google Ads, support platforms like Zendesk, and even finance tools. Also, identify key stakeholders in each department.
Step 2: Centralize Data in Snowflake
Create ingestion pipelines from each system into Snowflake. You can use tools like Fivetran, dbt, or custom scripts. Also, set up virtual warehouses to isolate workloads, like reporting vs transformations. Furthermore, apply row-level security and governance policies to ensure compliance.
Step 3: Define Core Metrics in Snowflake
Let DataOps define standardized metrics using Snowflake SQL or views. For example:
- Lead Velocity Rate
- Marketing-attributed Revenue
- Monthly Recurring Revenue (MRR)
- Churn or Retention Rate
This logic becomes the source of truth used across departments.
Step 4: Set Up Tableau Integration
Connect Tableau to Snowflake using OAuth or key-pair authentication. Snowflake’s single-factor auth is deprecated after May 2025. So, avoid legacy methods.
Pro tip: Make sure to use the latest Tableau-Snowflake drivers for optimal performance and compatibility.
Step 5: Publish Certified Sources in Tableau
Tableau allows data stewards to publish and certify sources. These sources can include metadata, descriptions, owners, and access controls. That way, if someone builds a dashboard, others know whether the underlying data is trustworthy.
Step 6: Build Role-Based Dashboards
Tailor dashboards for each user type:
- Marketing: Reach, spend vs ROI, funnel breakdown, and channel efficiency
- Sales: Pipeline by stage, lead source conversion, and quota vs actuals
- Executives: Combined view of acquisition, conversion, revenue, and retention
Moreover, use Tableau’s permissions model to manage visibility and editing rights.
Step 7: Train & Empower Users
Train contributors like analysts, sales ops, and marketers on how to use Tableau’s interface and the importance of using certified Snowflake sources.
Remember to promote self-service exploration. But ensure logic remains centralized.
Step 8: Iterate and Scale
Add new data domains. These include product usage, CSAT, support SLAs, and billing. Then, expand the dashboards accordingly.
You can also integrate AI/ML outputs as data fields within Snowflake and visualize predictive insights in Tableau.
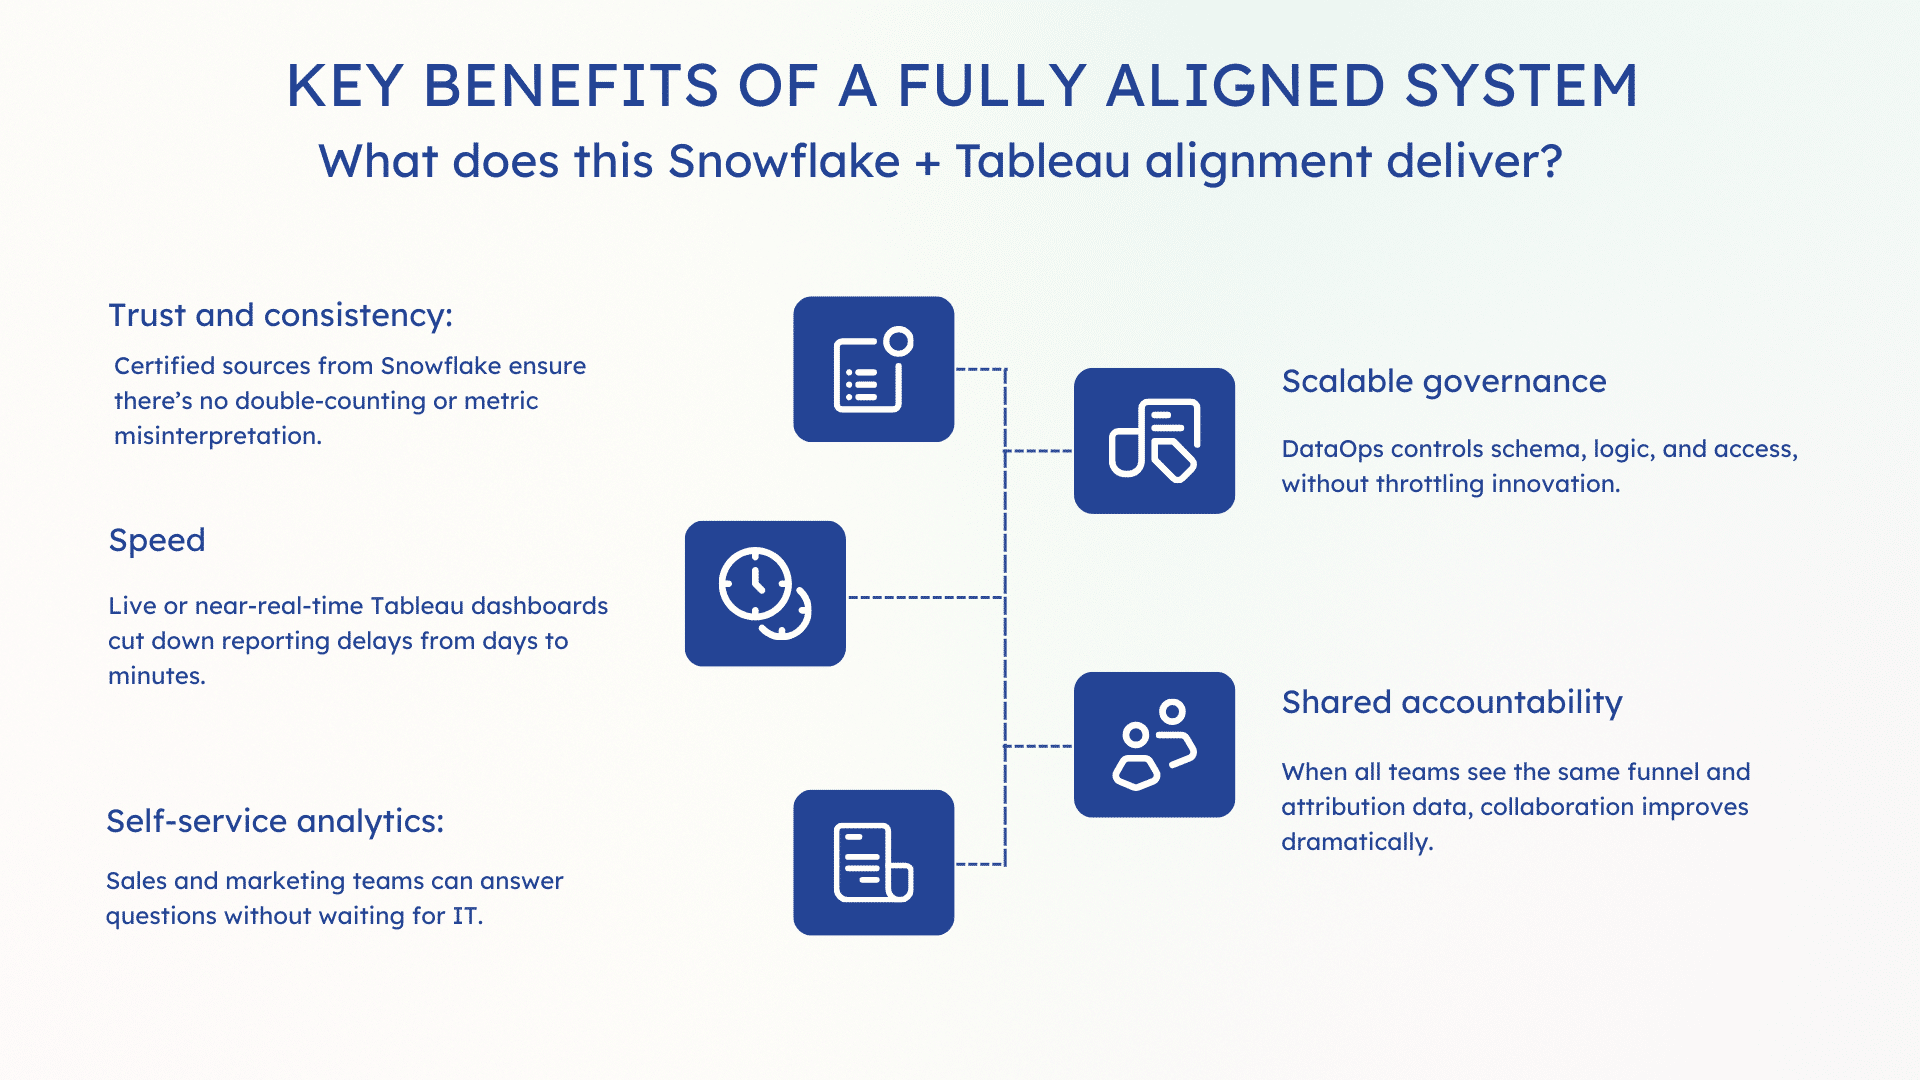
Key Benefits of a Fully Aligned System
What does this Snowflake + Tableau alignment deliver?
- Trust and consistency: Certified sources from Snowflake ensure there’s no double-counting or metric misinterpretation.
- Speed: Live or near-real-time Tableau dashboards cut down reporting delays from days to minutes.
- Self-service analytics: Sales and marketing teams can answer questions without waiting for IT.
- Scalable governance: DataOps controls schema, logic, and access, without throttling innovation.
- Shared accountability: When all teams see the same funnel and attribution data, collaboration improves dramatically.
The eventual result of this alignment: Improved efficiency and increased organizational maturity in data operations.
Conclusion: A Bridge Worth Building
When organizations integrate Snowflake’s governed data foundation with Tableau’s dynamic analytics, they build a bridge between strategy and execution.
This bridge connects sales, marketing, and DataOps around a shared truth. It ends misalignment, improves agility, and makes a strong base for AI-powered decision-making.
When everyone trusts the same metrics, they stop debating and start delivering.


